$ cat posts/diversity-in-software-development.md
Diversity in software development: we're in bad shape!
Table of contents
On May 27 the popular site StackOverflow published the results of its 2020 survey of software developers.
StackOverflow is a very popular site in the software development world. For those who don’t know it, it’s an open question-and-answer forum, built in 2008 by Jeff Atwood and Joel Spolsky, two famous and influential IT bloggers.
The original idea was to create a question-and-answer site for software developers that used a reputation and recognition mechanism to determine the best answer. Over time the site became a heavily used reference for developers all over the world, who turn to it to find answers to their most common problems.
The site has drawn its share of criticism and questioning. As with many other similar sites, participation isn’t all that high. As Ricardo Baeza points out1, over time we’ve seen that the “Wisdom of the Crowd” concept, so popular back when StackOverflow was born, didn’t turn out to be all that true.
On StackOverflow only 0.46% of users have reached a reputation level above 5,000, and most of those who answer only answer one question. Only 8% answer more than 5 questions. So participation isn’t what its creators expected. There are also studies showing that developers who use code taken from the site produce more insecure software than everyone else2.
The people at StackOverflow are aware of the criticism, which is why for ten years now they have run a survey to try to understand their community better and achieve more diverse participation.
That has made it the largest developer survey in the world. The 2020 edition was answered by more than 65,000 people.
And although you have to keep in mind that there’s a significant bias, it still provides valuable and interesting information.
This year they made an effort to reach a more diverse representation of developers, and to do that they promoted the survey much less on their own channels and published it in a variety of places. Despite the effort, they didn’t get the significant increase in representation they were hoping for. They did get some increases in the representation of Latinos and people of African descent, but other races and ethnicities held steady or even dropped. The same goes for gender representation: there was a slight increase in female representation, while those who identify as non-binary and as other genders stayed the same. The positive part is that StackOverflow acknowledges it has a lot to do to increase inclusion in its community.
But let’s look at some of the data this site found3.
This time I’ll skip the more technical questions and focus only on demographic and socioeconomic aspects; in an upcoming post I’ll talk about the other findings.
Race and ethnicity
68.3% of all respondents identify as white or of European descent. The second group is South Asians, with 10.4%, and the third identifies as Hispanic or Latino, with 7.6%. These figures go up a bit when you look only at professional developers: the share rises for whites (70.7%) and for Hispanics and Latinos (7.8%), and drops to 9.6% for South Asians:
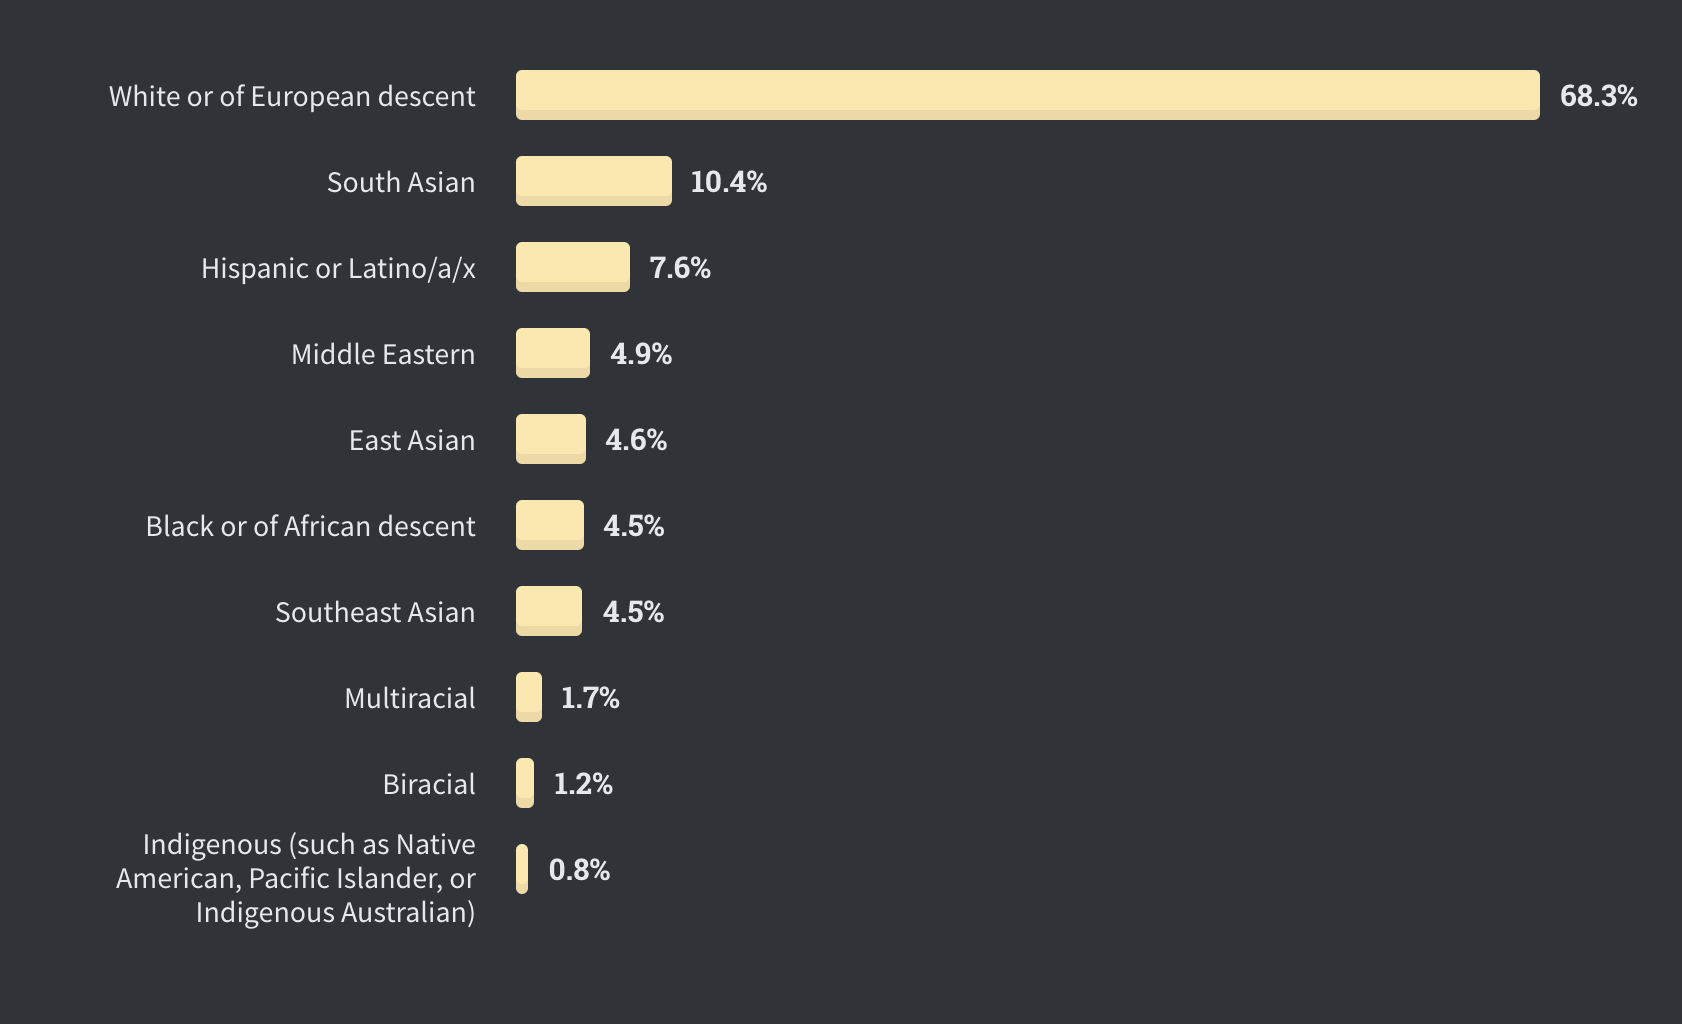
Ethnic representation for all survey respondents
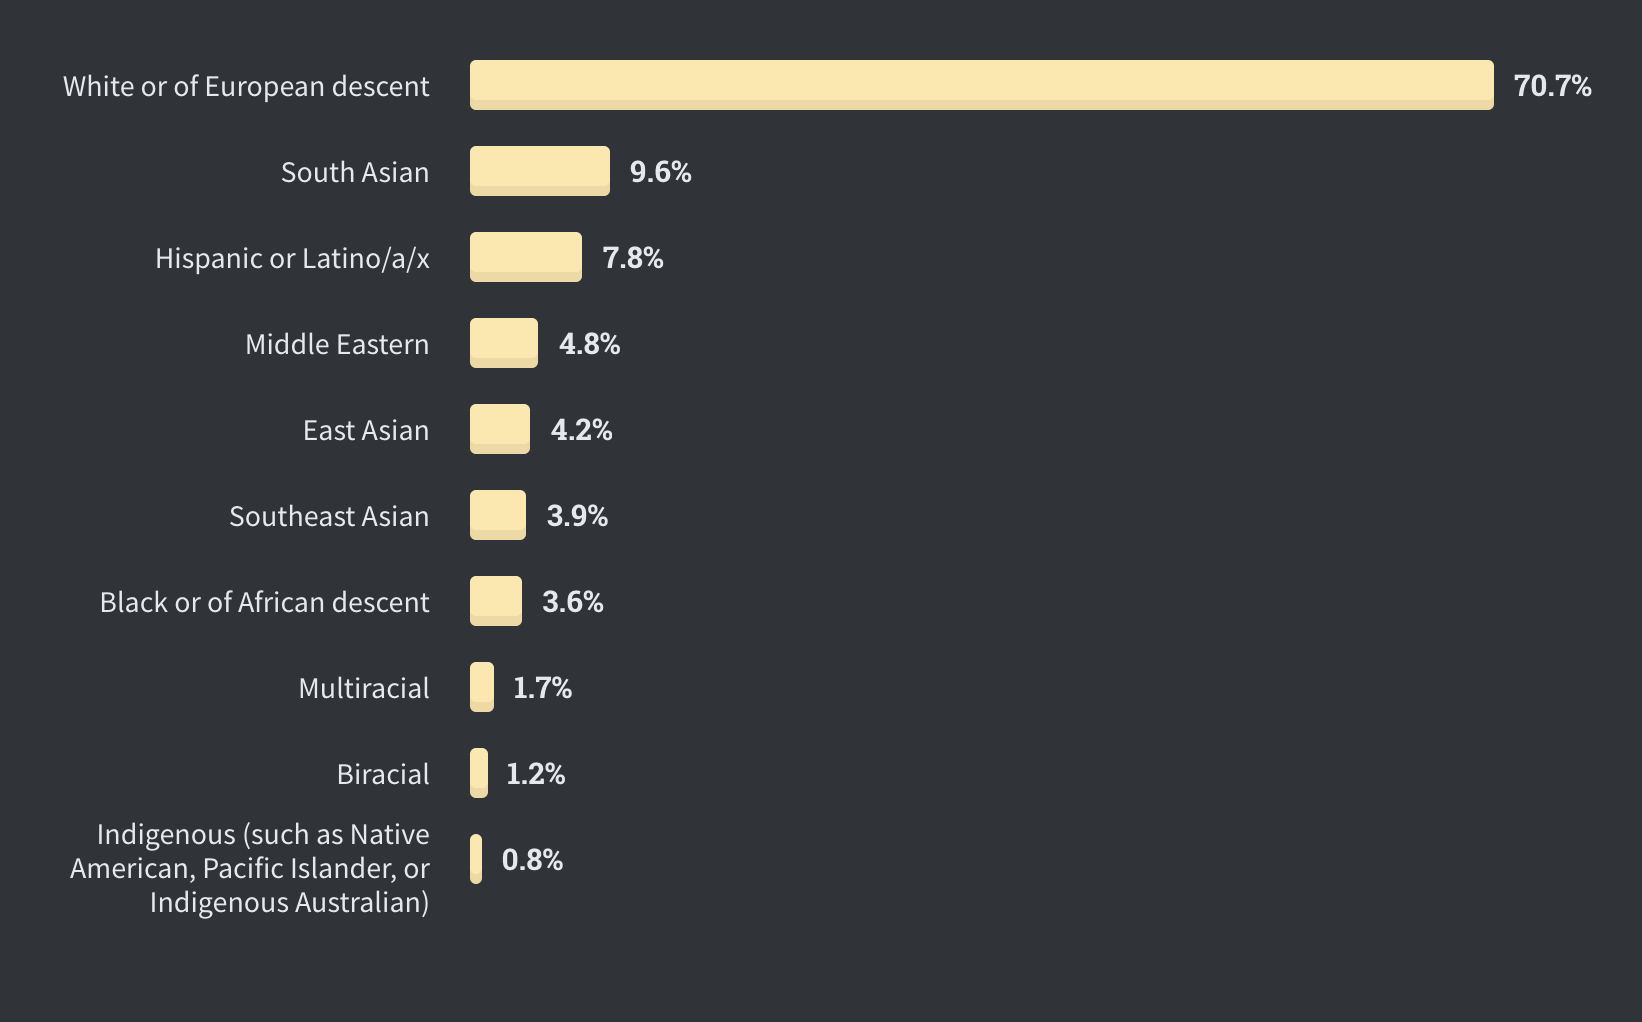
Ethnic representation for all professional developers who responded to the survey
Gender and sexual orientation
The gender question was answered by 50,557 people. And 91.5% identify as men, with 8.0% identifying as women:
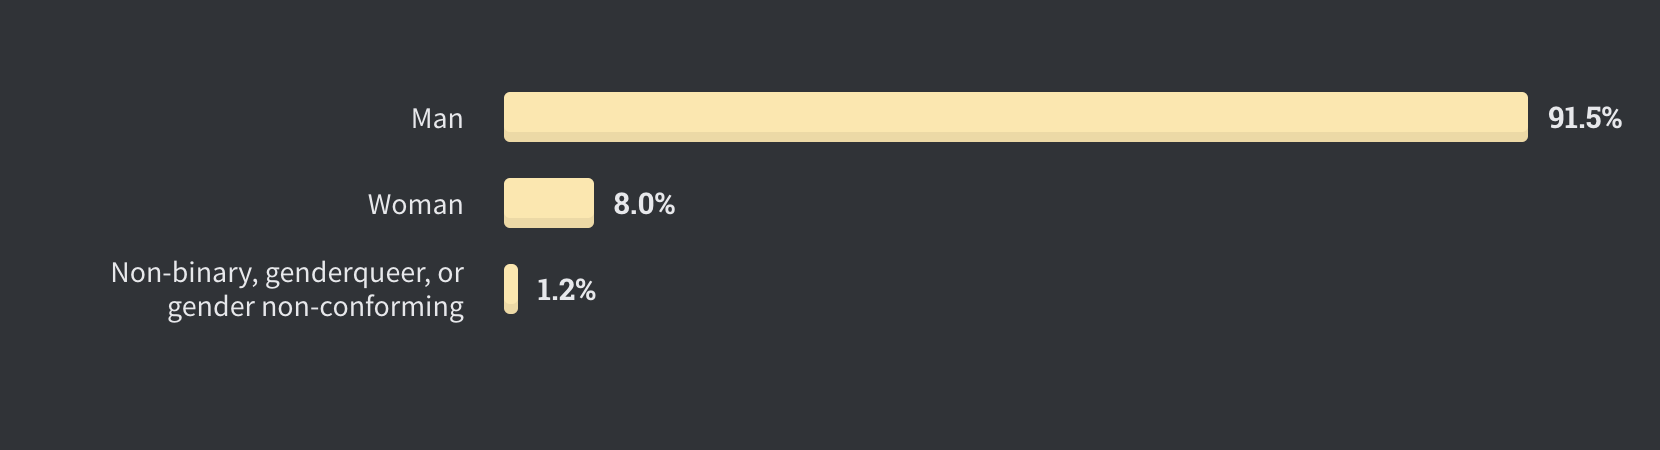
Gender identification, out of 50,557 responses
In addition, 1.0% identified as transgender (out of 49,345 people who answered that specific question).
As for sexual orientation, 92.1% identified as heterosexual and 5.7% as bisexual, out of 43,992 responses:
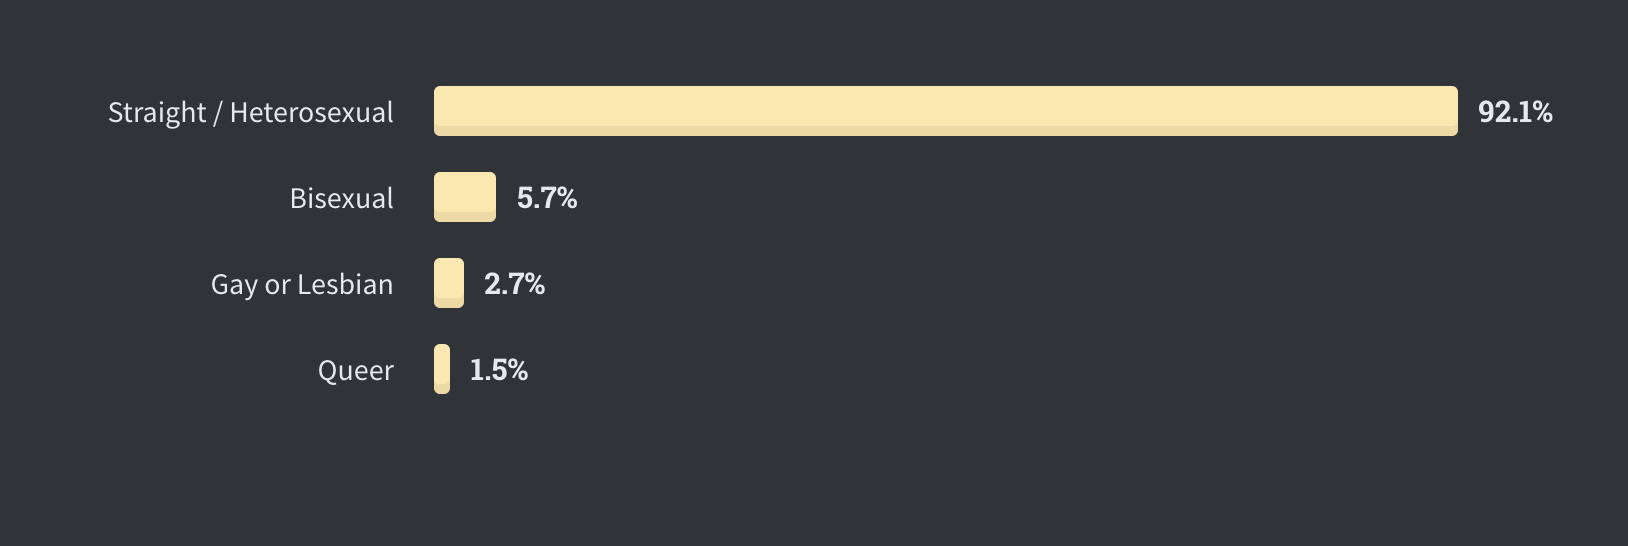
Gender identification, out of 49,992 responses
Gender and roles, plus experience
The following chart shows participation by gender across different specialties:
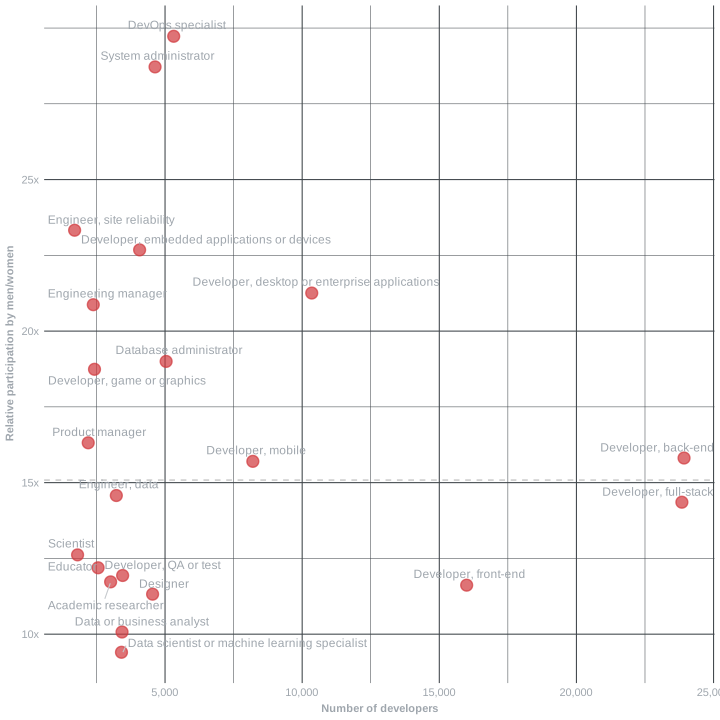
On the vertical axis we see the ratio of men to women by specialty, and on the horizontal axis the number of developers who answered the survey.
You can see that the ratio among DevOps specialists is almost 30 to 1.
The average ratio is 15 to 1. That works out to 6.6% female representation.
We can also infer that the area where the ratio of men to women is lowest (and therefore female participation is highest) is Data Science and Machine Learning, with values under 10 to 1 (that is, more than 10% female representation). But the numbers are smaller (fewer than 500 women who answered the survey).
The largest female presence would be among front end, backend and full stack developers. The ratio there is worse than in Data Science, at close to 15 to 1, but the number of people is larger.
And if this ratio is worrying, because it shows a low level of participation that we haven’t managed to turn around, there’s another finding that is more worrying still.
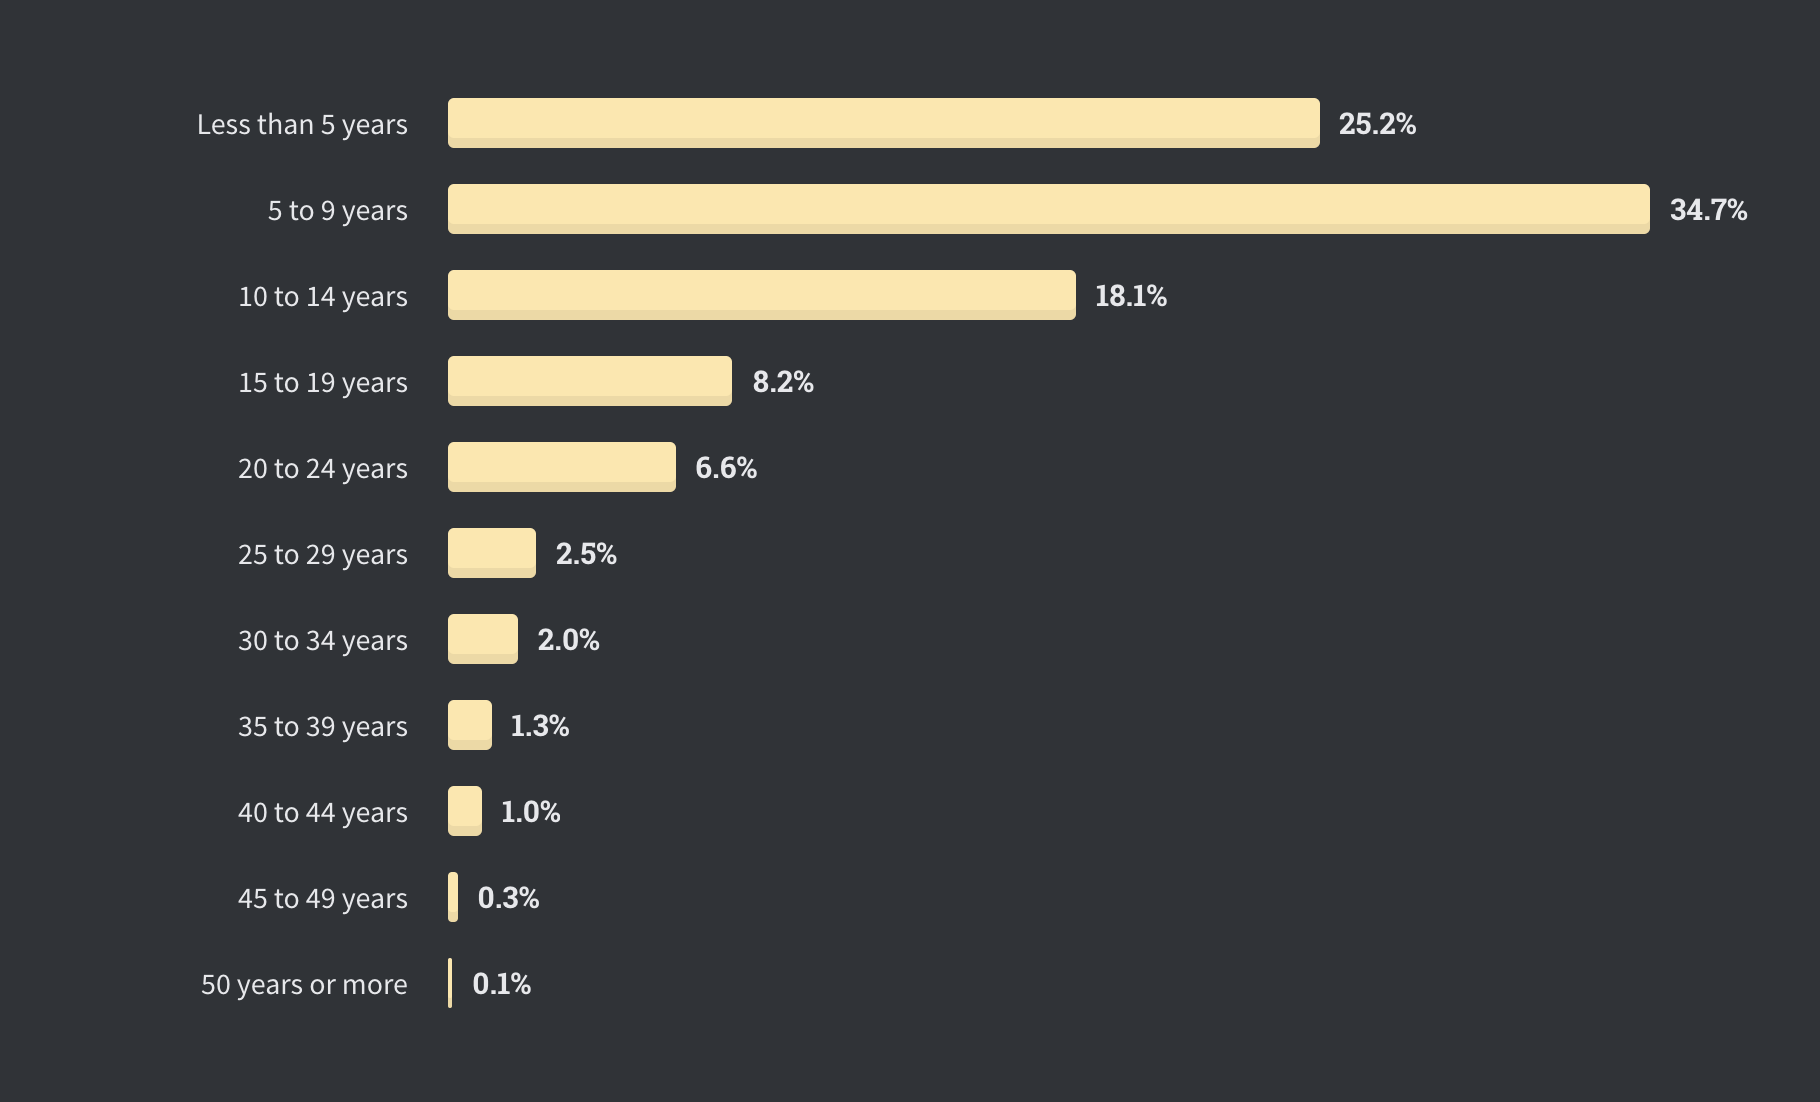
Years of experience of women in the field
These findings are consistent with other studies showing that women leave the technology field after 14 years in it, on average.
It’s clear we still have a lot to do.
Software development is still a hostile environment for any gender other than male. It’s a white, heteronormative environment, and one with very little tolerance for diversity. And that is serious.
Technology affects everyone’s life, so it requires more ethnic and gender representation, and improving this is a duty4.
I invite you to discuss these findings and share ideas about what to do.
You can find the survey analysis at this link: https://insights.stackoverflow.com/survey/2020#overview
Ricardo Baeza, Diego Saez: “Wisdom of the Crowd or Wisdom of a Few?” available at https://www.researchgate.net/publication/299867310_Wisdom_of_the_Crowd_or_Wisdom_of_a_Few ↩︎
Many of these observations are collected in this Wikipedia article: https://en.wikipedia.org/wiki/Stack_Overflow. ↩︎
Data and findings taken from https://insights.stackoverflow.com/survey/2020#overview ↩︎
Mars needs women: https://lnds.net/blog/lnds/2013/09/08/marte-necesita-mujeres/ ↩︎
Comments
comments powered by Disqus